Weather Station
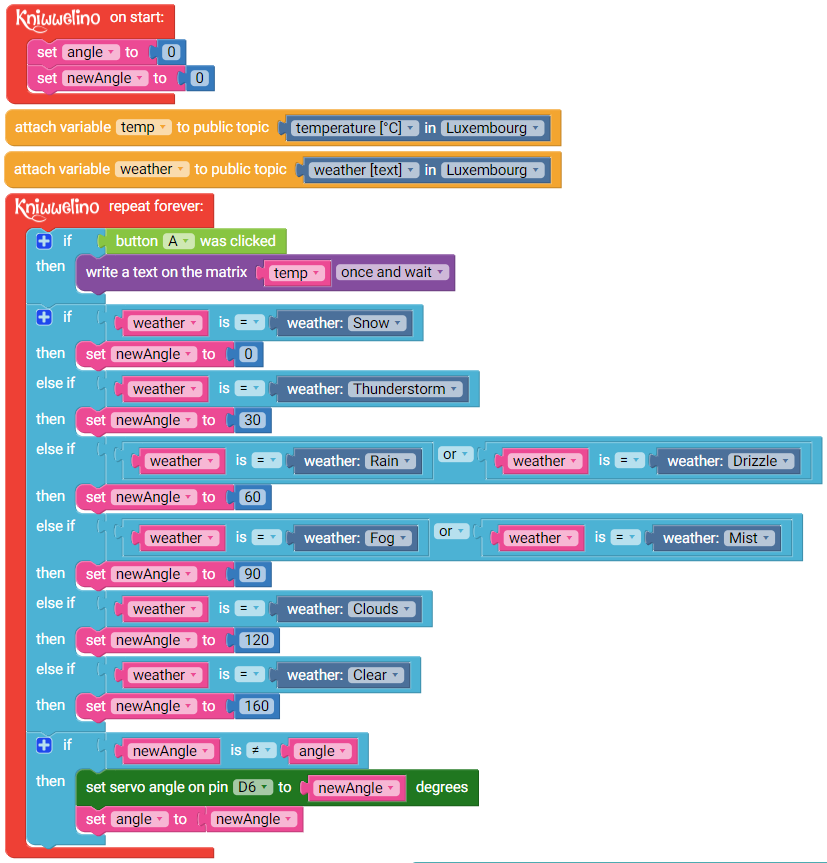
This weather station shows the current weather condition and temperature measured in a selected city. It is based on data from OpenWeatherMap and uses a servo to point an arrow to the current weather condition. When clicking button A, the temperature will be displayed on the matrix.

Needed materials
- 1 Kniwwelino
- 1 standard servo
- 1 USB cable
- 1 USB charger
- 2 paper plates (+- 23cm)
- coloured paper
- double-sided tape
- glue
- scissors
- cutter
Crafting
Model
The model for the weather station is available here: model_weatherstation.pdf
Instructions
- Use the model (part A) to draw and cut the hole for the Kniwwelino. Cut a small hole in the middel of the plate to fit the servo.

- Cut the connector of the servo, and remove about 1cm of the wire isolation (using e.g. scissors).

- Wind the ends of the wires to the pins 3.3V (red wire), GND (black or brown wire) and D6 (orange wire).

- Draw weather icons on the circles of the model (part C) and cut them. Copy the larger circle of the model (part B) on the coloured paper to create circles of different colours. Stick your icons on these coloured circles.

- Stick small pieces of double-sided tape next to the hole on the inside of the plate.

- Fix the Kniwwelino, the servo, the USB cable and all the wires with double-sided tape or normal tape.

- Use the second plate to close the station. Return the station and fix all the icons with glue on one half of the plate. Create the arrow using the model (part D) and stick it onto the servo.

Programming
Open project in KniwwelinoBlockly
Simplification
If you have no servo, you can also place the Kniwwelino in the center of the paper plate and display the arrow digitally on the matrix.
The step-by-step instructions for this version are also available as pdf to download and print: 180621_fly_instructions_meteo_v03.pdf

Open project in KniwwelinoBlockly

Extension
As a possible extension you can use the matrix to display the evolution of the temperature within the last hours. The last column represents the current temperature, the first four colums show the past measures relatively to the current one (in intervals of 30 minutes). A pixel one row lower means that the temperature was 1 degree lower.

To programm this extension you need to initialize a variable for each past temperature value, as well as a timer.
Note: to force a variable to be of type floating point (e.g. 15.0), you need to type 15.0f in the block.

Create a function called refresh which will display the temperature curve on the matrix.

This function is called after having clicked button A (and showing the temperature as scroll text).

As part of the main loop, check how much time has passed since the last update of the temperature curve. If 30 min (1800 sec) have passed, then update all variables, reset the timer and refresh the display.
